Tuesday, 20 December 2016

Education and skills foster health and well-being, but why is this a problem?

by Dirk Van Damme
Head of the Innovation and Measuring Progress Division, Directorate for Education and Skills


Knowing, for example, that tobacco is bad for one’s health influences smoking behaviour much less than being able to control one’s own lifestyle. Schooling, together with non-formal and informal learning experiences, has been found to foster the acquisition of skills that matter for health behaviour. It is one of the great insights of recent educational research that education is a very important driver of social progress, and that this happens through the transfer of knowledge and the development of cognition, but probably even more so through fostering the social and emotional skills that allow people to control and change their behaviours.

Traditional economics measure the benefits of education and skills in its economic gains in employment or earnings. These measures include for example the ‘rate of return’ of an individual’s investment in educational attainment or skills acquisition as the annualised average financial benefit, in much the same way as interests rates on capital investment are calculated. This is more or less equivalent to measuring, at an aggregate level of a country or region, the growth rate in the ‘gross domestic product’ (GDP) or total economic output to indicate economic growth.

Whilst such economic measures remain important and influential, they have been increasingly criticised for being one-dimensional and reductionist. They poorly reflect the diversified and holistic nature of human and social progress, well-being or happiness. The publication of the so-called Stiglitz-Sen-Fitoussi report, named after the three chairs of the Commission established by ex-French President Sarkozy to develop new measures of economic performance and social progress, was a pivotal moment for the international community that GDP did not tell the whole story of human development. International organisations – and together with the World Bank and others the OECD has taken a leadership role in this – have started to develop the measurement tools and methodologies for a multidimensional approach to well-being and social progress.

Similarly, work has been undertaken in recent years to develop a more holistic and multidimensional set of measures for estimating the various benefits of investment in education and skills, moving into fields such as health, interpersonal trust, life satisfaction, political engagement, citizenship or volunteering. For a number of years Education at a Glance has included an indicator on these so-called ‘social outcomes of education’, based on the analysis of various data collections. This issue of Education Indicators in Focus brief discusses the most recent findings of this work.

The chart above, focusing on self-reported health, is a good illustration; its pattern is not very different from the ones found for other social outcomes. Both educational attainment (horizontal dimension) and skills, measured by literacy skills, (vertical dimension) are associated with better self-reported health. The chart also shows that although there are strong interactions between education and skills, each has an impact of its own. Within each attainment level the literacy skills level of individuals is also positively associated with the health outcome, and vice versa.

Correlation does not however imply causation. Obviously there are selection effects and factors that mediate the relationship such as employment, work environments, living standards or income. But research that controls for such factors has found that there also is an independent education effect on health outcomes through the acquisition of skills that drive pro-health behaviours. Analysis of longitudinal datasets by the OECD Centre for Educational Research and Innovation’s Education and Social Progress project has shown that cognitive and non-cognitive skills acquired informal education and through informal learning change the health behaviour of individuals and improve general self-perceived health. Moreover, the non-cognitive social and emotional skills, such as self-control, perseverance and conscientiousness, seem to exert a bigger impact on health outcomes than cognitive ones.

Research on the economic benefits of education and skills has focused on the returns for individuals. Work on the social outcomes of education has also emphasised the benefits for individuals’ success in life. But what about the effects on communities and societies? Can we actually assume that the positive outcomes of education and skills at the individual level add up to better living conditions and well-being for everyone? In the case of economic returns this is far from evident. The data from Education at Glance shows us that economic returns depend on the wage differentials with less educated individuals. High rates of return mirror high levels of income inequality. Countries with less unequal income distributions show lower economic returns. Raising the share of tertiary-educated individuals in a country, leading to higher returns for those individuals, might increase social inequality if the lower attainment levels are left unchanged and the higher attainment levels concentrate on a larger share of the social product.

In the case of social outcomes this is much less the case. Individuals with higher social returns on education do not concentrate the social surplus, but there are important spill-over effects to other individuals. An individual with better health behaviour will have a positive impact on his or her social environment. Likewise, a person with higher interpersonal trust will positively influence his or her community. Better health outcomes of education thus add up to societies with higher longevity, and higher levels of individual interpersonal trust aggregate to more cohesive societies.

However, we should not be too positive about the impressively high education and skills gradient in various social outcomes. The positive impact of education and skills on health is only evident because low-educated individuals show poorer levels of self-reported health. The education and skills gradient also shows that people who have missed the opportunities for quality education and who lack the skills pay a high price in their own health. As much as we praise the good health of high-educated individuals, this remains a social problem and an educational challenge.

Links:
Education Indicators in Focus No. 47: How are health and life satisfaction related to education? by Simon Normandeau and Gara Rojas Gonzalez.
Education at a Glance 2016: OECD Indicators
Follow the conversation on twitter: #OECDEAG
Chart source: OECD Survey of Adult Skills (PIAAC) (2012, 2015). See Education at a Glance 2014 for more information, www.oecd.org/education/education-at-a-glance-19991487.htm.

Friday, 16 December 2016

Minutes Count in the Cleveland Clinic Florida Emergency Room: Patient Story

"A Florida woman is rushed to the emergency room with life-threatening injuries and only minutes to live. Experience her story as the Cleveland Clinic Florida Emergency Department team springs into action to save her":


Disclaimer: I work at Cleveland Clinic Florida, but I am not paid for this post.

Wednesday, 7 December 2016

Lessons for France from PISA 2015

by Gabriela Ramos
OECD Chief of Staff and Sherpa to the G20


Fifteen years ago, the OECD started evaluating education systems worldwide by testing the knowledge and competences of 15-year-old students through the Programme for International Student Assessment (PISA). Right from very first PISA exercise in 2000, we noted that although the results for France were around the OECD average, they revealed a system where children’s socio-economic status had a disproportionate influence on their school grades, and where children from disadvantaged backgrounds did not receive enough support.

The OECD PISA 2015 results are now in. Even if France’s performance hasn’t deteriorated since the last series in 2012, it has not improved much compared to previous rounds either. France’s results for science and mathematics are around the OECD average, while reading comprehension is slightly above average.

Nonetheless, the French system is still markedly two-tier. The number of high-performing students is stable and higher than the OECD average, but lower levels are not improving, with a proportion of 15-year-olds in difficulty in science higher than the OECD average.

According to PISA 2015, students from the most disadvantaged backgrounds are three times less likely to succeed in performing than advantaged students. This is not only a human tragedy. It is also a brake on economic development, which can only be solid and sustainable when it is inclusive.

Reconciling educational excellence and success for all is not just the best way to tackle social inequalities at the root, but also to obtain good results.

Results from around the globe illustrate various best practices applied to improve the equity and performance of the education system. Portugal’s TEIP programme for example (Priority Intervention Education Territories) targets investment in geographical regions where the population is socially disadvantaged and where school dropout rates are higher than the national average. Singapore, first in the PISA science rankings, has a comprehensive teacher evaluation system that includes, in particular, the contribution to students’ personal and academic development, as well as the quality of parent-teacher relations.

In short, the capacity of a system to help students in difficulty and those from disadvantaged backgrounds to improve raises the general quality of the system and thus its overall performance.

In France however, investments in education do not always reach these groups. I had some personal experience of this malfunctioning when I arrived in France and asked people to recommend primary schools for my own children. The answer was: “Don’t pick a school, pick a neighbourhood”.

How can we ensure that success at school isn’t the result of a postcode lottery? France has already implemented reforms going in the right direction.

As recommended by the OECD, more resources, teachers, scholarships and support have been made available for disadvantaged students. The July 2003 Education Act (Loi d’orientation et de programmation pour la refondation de l’école de la République du 8 juillet 2013) designed to tackle school drop-out and failure from the earliest age marks an important step. The recent implementation of numerous reforms inspired by the Act at primary and junior high levels, could, depending on their practical application, respond to certain ongoing challenges and help to improve students’ learning and outcomes.

Of course it is too early to see any impact of these reforms on PISA 2015 scores. However, they were necessary and should be strengthened and evaluated regularly.

In France, as elsewhere in the past, teachers will play a key role in the reforms and will have to take ownership of the main objectives. Reform of teacher training should therefore be continued and made a priority.

It is important to stress that contrary to a commonly-held belief in France, the PISA 2015 results do not show that reforms designed to reduce social and educational inequalities result in a lowering of the overall level. On the contrary. In countries that carried out such reforms, the number of failing students dropped in the following decade, while the good students got even better. OECD countries that have managed to achieve high performance in science along with equity in terms of educational outcomes include Canada, Denmark, Estonia, Finland, Japan, Korea, Norway and the United Kingdom according to PISA 2015.

We chose science as the focus of PISA 2015 because a good understanding of science and the technologies derived from it is indispensable, especially in our age of digital revolution. This is not only a necessity for those whose career depends directly on science, but for every citizen who wants to take an enlightened position on any number of questions facing society today, from health to sustainable development or climate change. Today, everyone should be able to “think like a scientist”.

More generally, education is fundamental in these troubled times, when populism is on the rise, when France has been shaken by several terrorist attacks, and social inequalities in the world have left by the wayside a number of citizens who no longer have any trust in institutions.

More than ever, we have to invest in our children’s science education, to respond to the “post-fact” era with an open and informed dialogue. More than ever, we have to strengthen our education systems to face up to the challenges that increasingly threaten to divide us.

Links:
Programme for International Student Assessment (PISA)
PowerPoint (in French)
PISA 2015 - Compare your country by OECD
Photo credit: © Iakov Filimonov / Shutterstock

Tuesday, 6 December 2016

Today’s the day

by Andreas Schleicher
Director, Directorate for Education and Skills


The latest results from PISA are released today. Before you look to see how well your country performed on the triennial test of 15-year-olds students around the world, consider this: only 20 short years ago, there was no such thing as a blog. If it weren’t for science and technology, not only would you not be reading this right now, but there wouldn’t be the device on which you’re reading it – or countless other gadgets, medicines, fibres, tools… that have become all but indispensable in our lives.

Obviously, we don’t all have to be scientists to live in the 21st century. But an understanding of some basic principles of science – like the importance of experiments in building a body of scientific knowledge – is essential if we want to make informed decisions about the most pressing issues of our time (or even if we just want to choose the “healthiest” option for lunch).

PISA 2015 focused on students’ performance in and attitudes towards science. More than half a million 15-year-olds (representing around 29 million students) in 72 countries and economies sat the test. Today is the day we find out whether students around the world can take what they have learned in school and use it to solve problems they might encounter in “real” life.


What do the results tell us? For an easily digestible summary of the findings and their implications, see this month’s special edition of PISA in Focus or watch the video above. (And if you’re not sure you really understand how PISA works, or what influence it might have over education policy, check out these animations: How does PISA work? and How does PISA help shape education reform?) But if you want to dig deeper, the first two volumes of the PISA 2015 Results (Volume I, Volume II), published today, present all of the results, and examine how student performance is associated with family background, the learning environment in school, and the policy choices governments make. (And we have science and technology to thank for enabling you to sample any or all of these by just tapping your finger.)

So tap into the world’s most comprehensive set of data on learning. You’ll probably learn something, too.

Links:
PISA 2015 Results (Volume I): Excellence and Equity in Education
PISA 2015 Results (Volume II): Policies and Practices for Successful Schools
PISA 2015 Results in Focus
PISA 2015 Résultats à la loupe

Programme for International Student Assessment (PISA)

Monday, 5 December 2016

Looking forward to PISA

by Andreas Schleicher
Director, Directorate for Education and Skills


Tomorrow, the OECD will publish the 2015 PISA results. The world’s premier global metric for education will tell us which countries have the best school systems, based on the performance of 15-year-olds in science, mathematics and reading over a two-hour test. 

PISA (the Programme for International Student Assessment) was introduced in 2000 and held every three years since. The test is of skills, not knowledge: what you can do with what you know is what counts. But over time the emphasis has shifted. The focus today is whether students can think like a scientist, reason like a mathematician and distinguish between good and bad arguments in a written text. We live in an era of unimaginable technology breakthroughs, conflicting values and threatened political norms. Literacy, in all three of the foundational domains, is the key to making sense of the world and shaping it for the better - for everyone, not just elites.

The value of PISA lies in comparison. Countries look beyond their borders for evidence of effective policy and PISA provides a yardstick for evaluating success. It ranks the performance of countries on quality, equity and efficiency. And by picking out the characteristics of high-performing systems, it allows educators to identify successful policies and adapt them to local contexts.   

In the last PISA round, in 2012, the best performing countries were in Asia. Asian countries took the top five spots in both mathematics and reading and the top four in science (with Finland in fifth place). But behind the headlines lie important insights. In Estonia and Finland there were only small variations in student scores, showing that quality can go hand-in-hand with inclusion. In Canada, Macao and Hong Kong, socio-economic disadvantage among students had relatively less impact on individual performance: poverty is one thing, destiny quite another.  

So what will we learn from PISA 2015? For the first time in a decade, the report concentrates on science. Has science education improved? Around the world, have 15-year-olds got better at explaining phenomena scientifically, designing scientific enquiry and interpreting data scientifically? Is the gender gap in science education closing? Have poorer students caught up? And where countries have maintained high performance or improved from where they were, what were the factors? Where should the balance lie between additional investment, great teaching and coherent long-term leadership?

The global stakes are high, first because of growing demand for scientists in the workplace, second because every one of us needs a scientific perspective. The demand for scientists comes from the transformational impact of science and technology. Given the accelerating pace of invention and innovation, its vital that countries prepare more young talent for more jobs in hard science - and for many other jobs with a science dimension. The broader need for scientific literacy stems from the centrality of science to everyday decisions. Whether buying toothpaste, recycling household waste or attending a meeting on the local effects of global warming, we are all subject to science-based claims and counter-claims. Can we separate substance from spin, identify misrepresentations and assess levels of uncertainty and trustworthiness?  Post-truth politics is the neologism of the year and in some quarters expertise itself has become a dirty word. It is time to stand our ground – to insist on education as the key to civilised societies.

In many countries, educators are talking not only about skills but also values and attitudes. Singapore, Australia, Canada, Estonia and Finland – all of them among the top performing countries in previous PISA cycles - are rebuilding curricula around new forms of competence, such as critical and inventive thinking, global awareness and collaboration. They see values such as tolerance and respect as foundational. PISA too is developing rapidly. Next year we will publish the results of an additional 2015 assessment of collaborative problem solving, and we have advanced plans for assessing inter-cultural sensitivity in 2018. Creativity, entrepreneurship and ethical thinking are all under consideration for future cycles.

But with the seventy PISA countries and economies, the OECD believes that the bedrock of a good education should continue to lie in science, mathematics and reading. Literacy in all three offers prosperity, fulfilment and a chance to contribute to the well-being of others. Tomorrow, PISA 2015 will tell the world about its progress.  

PISA 2015 Global launch events

The OECD and Education Policy Institute will host a global launch event in London at the Institute of Directors with OECD Secretary-General Angel Gurría and Andreas Schleicher, OECD Director for Education and Skills.

The event will be live streamed from 09:45 – 12:20 GMT

This will be followed by on online public Q & A session starting at 2:00 GMT with Andreas Schleicher, OECD Director for Education and Skills. Questions in advance of the session will be welcome, using the #OECDPISA hashtag on Twitter and via the OECD PISA Learning Community

Links:
Programme for International Student Assessment (PISA)
Photo credit: © OECD

Discover your talent!

by Deborah Roseveare
Head of the Skills Beyond School Division, Directorate for Education and Skills

Last night I got a taxi home and as often happens, the driver and I got chatting. Then he asked me a rather strange question – “Do you like the smell in my car?” Well, I have to say the smell was a very subtle one but it led to a fascinating conversation. 

With some pride, he told me that he was trying out a new product for cleaning car interiors developed by a friend of his. His friend already had his own business selling these products and then came the big surprise – this friend is only 17 years old. But isn’t he still in school? I asked. Yes of course, he was doing a professional baccalaureate (a vocational programme here in France).


This talented young man, who was smart enough to have skipped a class in primary school, had a passion for chemistry and had been doing experiments – more or less successfully -- in his mother’s kitchen from a young age. So why had he chosen a professional baccalaureate? Apparently, he wanted hands-on learning, get practical experience and develop the skills that would help him succeed in his business ventures.


It’s not often that a taxi gets me home too quickly, but I ran out of time to ask more questions. It’s always great to hear stories about young people discovering their talent, finding an education pathway that supports them in following their passion and gaining the skills to succeed in life. So I’m looking forward to hearing many more success stories that show young people and adults how you too can “discover your talent!” during European Vocational Skills Week 2016, which runs from 5-9 December 2016. 


Why focus on vocational skills? In a changing and more competitive job market, Vocational Education and Training (VET) delivers specific skills and knowledge for the jobs of today and tomorrow, leading to great careers and good life prospects. Pursuing VET can lead to quality employment, an entrepreneurial mind-set, attractive and challenging careers, and opportunities for continuous upskilling and reskilling.


Sometime in the coming years I expect to hear about a successful young entrepreneur putting innovative cleaning products on supermarket shelves and I’ll remember how vocational education and training helped him discover and develop his talent and gave him the skills to succeed.

   
Links:
European Vocational Skills Week 2016
OECD Policy Reviews of Vocational Education and Training (VET) and Adult Learning 

Twitter hashtags: #EUVocationalSkills #discoveryourtalent
Photo credit: © European Commission

Wednesday, 30 November 2016

To contain the cost of education, should countries only consider teachers’ salaries?

by Dirk Van Damme
Head of the Innovation and Measuring Progress Division, Directorate for Education and Skills


High-performing education systems value teachers and invest a lot in them. And indeed, the human factor is crucial in creating effective and high-quality teaching and learning environments. On average across OECD countries, the compensation of staff involved in education counted for 77% of total expenditure on secondary education in 2013 (Indicator B6 of Education at a Glance 2016). In monetary terms, the annual salary cost of teachers per student at the lower secondary level reached USD 3 389, on average across OECD countries in 2014, but this amount ranged from USD 1 000 in Mexico to USD 5 379 in Austria. However, we also know that it is not the amount of money invested that counts, but the way it is used. PISA reveals that, above a certain threshold, more money invested in education does not necessarily lead to better outcomes. Countries that may spend the same per student often put that money to different use.

The new Education Indicators in Focus brief, based on the most recent data published in indicator B7 of Education at a Glance 2016, deepens the analysis on the factors influencing the per-student salary cost of teachers. Each country’s per-student salary cost is based on a mix of four main factors: teachers’ salaries, teaching time, instruction time and class size. The figure above shows the weight of each of these four factors, compared to the OECD average, in each country’s per-student cost of teachers. The differences between countries are striking, especially between countries that arrive at a similar per-student salary cost of teachers, but based on a very different mix of the four components mentioned.

Take, for example, two countries with a similarly high per-student cost of teachers, the Flemish Community of Belgium and Germany. In the former, the per-student salary cost is relatively high, because all four components are more cost-intensive than the OECD average, adding up to a high total salary cost even if the teachers’ salaries are not very high. In Germany, teachers’ salaries are much higher, but their impact on the per-student salary cost is offset by more-than-average teaching time and lower-than-average instruction time.

At the other end of the spectrum are the Czech Republic and Turkey, countries with a relatively low per-student salary cost of teachers. In the former, instruction time, teaching time and class size are close to the OECD average, but the per-student salary cost is driven downwards by much lower teachers’ salaries (in real terms). In Turkey, teachers are better paid than their Czech colleagues, but the per-student cost is offset by less instruction time and larger classes.

Is there, then, a particular mix of components that makes an education system more effective? Apart from Korea, most high-performing countries in PISA are found towards the left of the chart, indicating a relatively higher-than-average per-student salary cost of teachers. But even those high-performing countries do not share a common mix of components – except, perhaps teachers’ salaries. In all high-performing countries except Finland, teachers’ salaries are higher than the OECD average.

The impact of other factors – including class size – is much less clear. Education at a Glance 2016 shows that many countries have reduced average class size over the past decade or so, responding to political pressure and public demand. But the evidence on the impact of smaller classes on the effectiveness and quality of teaching and learning is patchy. Analysis of PISA data reveals that there might be some positive impact from reducing class size, but much less than if teachers’ salaries were raised or if more were invested in teachers’ professionalism, instead. Some academic research evaluates the effect of smaller classes more positively, but this research is mostly limited to North America and Europe, whereas large classes are the norm in high-performing systems in Asia.

The factor of instruction time has a similarly uneven impact on performance. Some high-performing systems, as measured by PISA, such as Finland, require less instruction time than on average across OECD countries, thus offsetting the cost of higher teachers’ salaries. But other countries, such as the Netherlands, show above-average instruction time, contributing to a relatively higher per-student salary cost. The Education Indicators in Focus brief n° 22 looked into the issue of instruction time in more detail, but did not find any conclusive evidence on the relationship between instruction time and the quality of learning.

In times when governments need to contain the cost of education, improve the quality of teaching and learning, and increase the efficiency of spending, the cost of the teaching force is a major area of concern. The evidence shows that there is no magic formula for mixing the components of the per-student salary cost, but it does suggest that prioritising teachers’ salaries over class size and instruction time makes sense. Lowering teacher salaries might be the easiest way to cut costs – and the evidence suggests that countries have done this in the recent past in response to the financial crisis – but a more sophisticated look into all the factors influencing the cost of education might be more appropriate.

Links:
Education Indicators in Focus No. 46: What influences spending on education? by Camila de Moraes
Education at a Glance 2016: OECD Indicators
Programme for International Student Assessment (PISA)
Chart source: OECD (2016), Education at a Glance 2016: OECD Indicators, www.oecd.org/education/education-at-a-glance-19991487.htm.

Friday, 25 November 2016

Skills are the key to unlocking prosperity in Peru

by Andreas Schleicher
Director, Directorate for Education and Skills


Skills are central to the future prosperity and well-being of Peru’s people

Peru has been one of the strongest economic performers in Latin America with steady GDP per capita growth over the past decade, which has been accompanied by a sharp decline in poverty rates and a significant rise in educational attainment.This impressive track record can only be if supported by a process of economic diversification, in which skills and human capital must play a central role.

Peru’s goal for the future is to diversify the economy and tackle informality, boost productivity in firms and expand export capacity, while raising its capacity to innovate and take part in global value chains with more complex goods and services. All of which will require a stronger skills base. Achieving better and more equitable skills outcomes will also contribute to building a healthier, more equitable, and more cohesive society.


Now is the time for Peru to invest in developing skills that are relevant to the needs of a rapidly evolving labour market, to fully activate the skills hidden in informal employment arrangements and to make the best use of skills by promoting high performance workplace practices.


Skills investments pay off 

We know that in countries where a significant proportion of adults have poor skills, it is difficult to introduce productivity-enhancing technologies and new ways of working. This, in turn, stalls innovation and improvements in living standards.


Yet skills affect more than just earnings and employment. The Survey of Adult Skills (PIAAC) shows that adults with lower literacy proficiency are far more likely than those with better literacy skills to report poor health, to perceive themselves as objects rather than actors in political processes, and to have less trust in others. The Survey has been conducted in over 30 countries and new data on the skills of Peru’s adults (aged 16 to 65 years old) will be available in 2019. This comparative data shows clearly that people who lack foundation skills struggle to participate fully in society, democracy and the economy.


Countries that are the most successful in mobilising the skills potential of their people share a number of features: they provide high-quality opportunities to learn throughout life, both in and outside school and the workplace; they develop education and training programmes that are relevant to students and the labour market; they create incentives for, and eliminate disincentives to, supplying skills in the labour market; they recognise and make maximal use of available skills in workplaces; they seek to anticipate future skills needs and they make learning and labour market information easy to find and use.


Mapping Peru’s skills challenges together

The OECD Skills Strategy provides countries with a framework for developing co-ordinated and coherent policies that support the development, activation, and effective use of skills.


Since October 2015, we have been working closely with Peru in applying the OECD Skills Strategy framework as part of a collaborative project to build a more effective national skills strategy. The National Project Team established by the Peruvian government to oversee this process is co-ordinated by the Ministry of Labour and Employment Promotion, and includes representatives from the Ministry of Education and the Ministry of Economy and Finance.


Today, the results of this work are published in the OECD Skills Strategy Diagnostic Report: Peru that sets out 9 skills challenges for Peru. These challenges were identified in the course of several rounds of discussions with the National Project Team, technical meetings with Peru’s leading experts and input from over 100 stakeholders such as employers, trade unions, education providers and experts gathered during two interactive workshops held in November 2015 and May 2016 in Lima. The report also draws upon OECD analysis and data as well as that of the United Nations Educational, Scientific and Cultural Organisation (UNESCO), the International Labour Organisation (ILO), the World Bank, the Inter-American Development Bank (IADB), and national data.


Peru’s 9 skills challenges

So what are the main skills challenges facing Peru today?

With regard to developing relevant skills, the report concludes that Peru should focus on:

  • Improving school completion and foundation skills in compulsory education
  • Improving access to quality higher education and transition to work

When it comes to activating its skills supply, Peru will need to tackle the challenges of:

  • Improving the labour market institutional setting to boost formal employment
  • Extending the reach of active labour market policies to improve workers’ employability

Peru could make more effective use of the skills it already has by:

  • Improving the alignment between skills supply and demand and fostering a better use of skills in the workplace
  • Putting skills to better use to foster a more diversified and productive economy

Finally, Peru could strengthen the overall governance of the skills system by:

    • Improving learning and labour market information to support better education and career choices, and evidence-based policy making
    • Improving co-ordination across different actors and levels of government to achieve better skills outcomes
    • Building partnerships to ensure that policies are responsive to changing skills needs

      Building a shared road-map for action

      As the first non-member country to embark upon a National Skills Strategy country project with the OECD, Peru has demonstrated its commitment to leveraging international comparative data and good practice to tackle its own skills challenges. Equally, this analysis of Peru’s skills system will be of great interest to many other countries around the world.


      Throughout this initial diagnostic phase, we have witnessed first-hand a strong commitment to improving Peru’s skills outcomes across government, employers and trade unions, as well as education and training providers.


      The true test lies ahead, in designing concrete actions to tackle the skills challenges facing Peru. Government cannot achieve better skills outcomes alone, so moving from diagnosis to action will require a whole of government and a whole of society approach.


      The OECD stands ready to contribute to Peru’s ongoing efforts to achieve its ambitious goals in designing and implementing better skills policies for better jobs and better lives.


      Links:
      OECD Skills Strategy Diagnostic Report: Peru
      Executive Summary (English)
      Executive Summary (Spanish)
      OECD Skills Strategy
      OECD Skills Outlook 2013: First results from the Survey of Adult Skills
      OECD Skills Outlook 2015: Youth, Skills and Employability
      A Skills Beyond School review of Peru, 2016
      For more on skills and skills policies around the world, visit:
      www.oecd.org/skills
      Photo credit: Man measuring SKILLS @Shutterstock

      Wednesday, 23 November 2016

      New insights on teaching strategies

      by Pablo Fraser
      Analyst, Directorate for Education and Skills


      Education’s purpose is to prepare children for a fast-moving, ever-changing world. Teaching faces the additional challenge of classrooms becoming increasingly more culturally diverse. Now, more than ever, this requires an adaptation of current teaching strategies.

      The recent OECD working paper Teaching strategies for instructional quality: Insights from the TALIS-PISA Link data seeks to be a contribution to this debate, by providing information about the teachings strategies used by mathematics teachers in eight countries.


      What is the TALIS-PISA link database?


      In TALIS 2013, participating countries and economies had the option of applying TALIS questionnaires to a PISA 2012 subsample with the purpose of linking data on schools, teachers and students. We call this option the "TALIS-PISA Link" database. The TALIS-PISA Link provides us with valuable information about teaching strategies and their relationship with the characteristics of the school, the classroom and student's outcomes. A better understanding of these relationships can help teachers, schools, education policy makers to design more effective policies with the aim of improving the learning achievements of all students.


      What are the most common used strategies used by teachers?


      The analysis of the data showed that teaching practices can be classified in three groups:

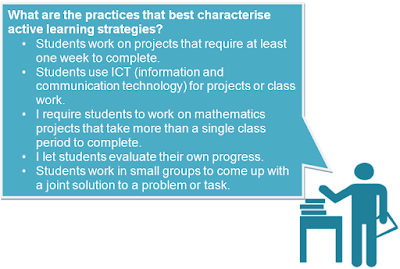
      • Active learning strategies, which consist of promoting the engagement of students in their own learning. They typically include practices such as group work, use of information and communication technology, or student self-assessment.
      • Cognitive activation, which consists of practices capable of challenging students in order to motivate them and stimulate higher-order skills, such as critical thinking, problem solving and decision making.
      • Teacher-directed instruction, which encompasses practices based on lecturing and rely to a great extent on a teacher’s ability to deliver orderly and clear lessons.
      It would be inappropriate, however, to favour one form of strategy over another, since all of them contribute towards student learning – depending on the student’s skills and the context. For example, data has shown that students exposed to teacher-directed strategies are slightly more likely to respond to the less complex items in the PISA mathematics evaluation, while cognitive activation strategies seem to be moderately related to solving more complex maths items. However, these associations appear to be tenuous and further explorations on the association of these strategies with student learning are needed.

      The results of the report showed that teacher-directed practices and cognitive activation practices are the strategies more often reported. Three out of four teachers reported presenting “a summary of recently learned content” (teacher-directed practice) or that they “go over homework problems that students were not able to solve” (cognitive activation practices). However, only around one-third of teachers reported engaging frequently in active learning strategies. Indeed, the frequency in which active learning practices are used seems to be particularly low for mathematics teachers. The lack of engagement in these strategies may indicate that the necessary support and policies that would allow teachers to develop these strategies are not in place.


      What are the policies and the support that could foster the use of active learning strategies?


      The working paper evaluated the association of active learning with a myriad of factors located at the school, the classroom and the teacher levels. One of the most interesting results is that in all the eight participating countries, teacher self-efficacy showed as being positively associated with the implementation of active learning practices: the more the teacher feels confident in his or her ability to provide quality instruction, the more likely he or she will be to engage in active learning strategies. Indeed, teachers must feel confident in their abilities in order to implement relevant teaching strategies.


      Also, when teachers dialogue, support and exchange materials with their colleagues, they are more likely to engage in active learning practices. Teachers should not work as isolated agents, but rather to engage in professional networks and in collaboration with colleagues.


      What education policies can best support teachers’ self-efficacy?


      Results from TALIS 2013 have shown that the level of self-efficacy among teachers in a country is highly correlated with teachers’ participation rates in professional development. The more teachers participate in training activities, the more confident they feel about their ability to teach, and the more they use active learning strategies. If professional development is not available at the school, school leaders could try to foster other types of initiatives, such as mentoring programmes.


      What can schools do to promote collaboration among their teachers?


      School leaders can provide opportunities for fostering relationships among their staff in school by giving them a physical space where teachers can meet, or allowing time away from administrative work for teachers to meet and develop a relationship with their colleagues.


      Teachers everywhere are committed to helping their students achieve the best they are capable of. The OECD, through the study of the TALIS-PISA Link data, seeks to provide guidelines on how to support them. The study findings can inspire teachers and school leaders to co-operate using a wider palette of techniques to meet the needs of students with varying abilities, motivation and interests. The insights provided here can also inspire education policy makers to design teaching policies that could foster the implementation of innovative teaching strategies.


      Links:

      OECD Education Working Paper No. 148: Teaching strategies for instructional quality: Insights from the TALIS-PISA Link data
      OECD Education Working Paper No. 130: How teachers teach and students learn: Successful strategies for school
      OECD Education Working Paper No. 115: Examining school context and its influence on teachers: linking TALIS 2013 with PISA 2012 student data

      Teaching strategies for instructional quality: Insights from the TALIS-PISA Link data brochure
      Asia Society (2016), Teaching and leadership for the twenty-first century: The 2016 International Summit on the Teaching Profession
      TALIS 2013 Results: An International Perspective on Teaching and Learning
      A Teachers’ Guide to TALIS 2013: Teaching and Learning International Survey
      Ten Questions for Mathematics Teachers ... and how PISA can help answer them
      Icon credit: teacher by Hadi Davodpour, CC0 1.0, table source: OECD.

      Friday, 18 November 2016

      “99 percent of all claims of being 115 or older are false.”

      An engaging story from the NYTimes about runners older than 90, and more.

      Among the quotes:

      “99 percent of all claims of being 115 or older are false.”

      “Old age always wins. It’s shocking. No matter how hard you try, it beats you.”

      Apart from that, nothing would stop him, not even a colostomy bag:

      "The oldest competitor would be an Australian legend, John Gilmour, 97, a World War II veteran who was captured by the Japanese and put into forced labor. Malnutrition and the harsh conditions permanently shrouded his vision. Still, he resumed his running career after the war. He knew what a body could withstand. The pain of sport was nothing compared with the pain of capture.

      In his mid-60s, he could still run a marathon under three hours."

      Read the full story here:

      http://www.nytimes.com/2016/11/20/sports/119-year-old-runner-world-masters-championships.html

      Image source: OpenClipart.org, public domain.

      Tuesday, 15 November 2016

      A peek at PISA

      by Marilyn Achiron
      Editor, Directorate for Education and Skills


      Sorry, we can’t divulge the results (those will be announced on 6 December); but now that we have your attention, we thought you might like to learn a little more about the test, itself, so that when the results are finally announced, you’ll have a better idea of what those results mean.

      PISA 2015 focused on science, with the understanding that, although not every student is interested in becoming a scientist, all of us now need to be able to “think like a scientist” sometimes – to be able to weigh evidence and come to a conclusion, and to understand that scientific “truth” may change over time, as new discoveries are made. This month’s PISA in Focus walks you through a typical question in the PISA science test and explains what it can show about students’ proficiency in science. Each question is designed to reveal a certain skill or set of skills. In PISA 2015, these skills included explaining phenomena scientifically (based on knowledge of scientific facts and ideas), evaluating and designing scientific enquiry, and interpreting data and evidence scientifically. 

      If you’re curious to see how you might do on the PISA science test, you can test yourself on a few sample science questions at www.oecd.org/pisa. And if you want a broader idea of how PISA works – which schools and students get to participate, what PISA really aims to do, and how participating countries and economies might use PISA results – take a look at the short, animated video, “How does PISA work?” at the same address.

      Now, we know that you really want to find out the results of the PISA 2015 test, so…

      Come back on 6 December!

      Links:
      PISA in Focus No. 66: How does PISA assess science literacy? Francesco Avvisati
      PISA à la loupe n° 66: Comment l'enquête PISA évalue-t-elle la culture scientifique ? 
      Find out more about PISA: oecd.org/edu/pisa
      Photo credit: © Hero Images Inc. / Hero Images Inc. / Corbis.

      Friday, 4 November 2016

      7 classical virtues of trust, justice, hope, temperance, wisdom, courage and compassion - and how this applies to medicine


      We often receive an email from the Chief of Staff on Wednesdays. The email is meant to unite the physicians at Cleveland Clinic around a common idea/topic/thought for that week.

      One of the emails mentioned "A virtuous culture built on the seven classical virtues of trust, justice, hope, temperance, wisdom, courage and compassion. These virtues offer us 25 centuries of wisdom about human conduct at its best."

      As a simple exercise, try thinking about one of those each day of the week, make it the "theme of the day":

      Monday - Trust
      Tuesday - Justice
      Wednesday - Hope
      Thursday - Temperance
      Friday - Wisdom
      Saturday - Courage
      Sunday - Compassion

      These concepts are not new, of course. There have been multiple different variations proposed throughout the centuries. Some examples are references below. If you feel adventurous, don't limit yourself to 7 virtues but consider the 24 Prussian virtues below:

      https://en.wikipedia.org/wiki/Prussian_virtues

      https://en.wikipedia.org/wiki/Cardinal_virtues

      https://en.wikipedia.org/wiki/Seven_virtues

      Monday, 31 October 2016

      "Bottle-flipping" is the latest fad, see why schools are banning it - WSJ video

      From WSJ: Bottle-flipping has become a worldwide phenomenon. But some schools are trying to ban the flippers:

      Friday, 28 October 2016

      Easier schedule for HPV vaccine: 2 doses instead of previously recommended 3

      From Mayo Clinic: To protect against cervical cancer and other cancers caused by HPV infection, the Centers for Disease Control (CDC) is now recommending that 11- and 12-year-olds receive two doses of HPV vaccine at least six months apart. This is a change from the previously recommended three-dose series.

      The CDC says adolescents ages 13–14 also can receive the HPV vaccine on the new two-dose schedule. However, those who start the series later will continue to need three doses.


      Self-administered HPV Test is one of the Top 10 Medical Innovations 2017, selected by the Cleveland Clinic:

      Do men’s and women’s choices of field of study explain why women earn less than men?

      by Dirk Van Damme
      Head of the Innovation and Measuring Progress Division, Directorate for Education and Skills


      Fields of education are ranked in descending order of the share of men who studied in this specific field.

      Although we’ve observed for a long time that young men and women tend to choose different fields of study – young men are more apt than young women to pursue a degree in engineering while more women than men opt for a teaching career, for example – until recently, we have had no reliable data to support this perception. Nor could we measure the impact of these choices on employment and earnings. But recent data collections, such as the Survey of Adult Skills (PIAAC), finally offer some quantitative evidence on these crucial issues.

      The latest Education Indicators in Focus brief summarises the available evidence from the Survey of Adult Skills on gender differences across fields of study. The data are mind-blowing. As shown in the figure above, across the countries and subnational entities with available data, only 7% of women had studied engineering, manufacturing and construction, compared to 31% of men. In contrast, the share of women who had graduated from a teacher-training and education-science programme or from a health and welfare programme is more than double that of men. These are averages, and differences among countries in the magnitude of the gender gaps between fields of study are also large.

      Why women and men choose to pursue different fields of study, and why those choices vary among countries, is not easy to determine. Gender stereotyping of jobs and occupations, which often result in different career expectations for girls and boys, and gendered roles in personal and professional life all influence the decisions that lead to gender-related differences in the choice of studies and careers. But whatever the causes may be, the consequences are clear. As discussed in the Education in Focus brief, employment patterns differ between fields of study, depending on the gender imbalance. Because of higher rates of inactivity among women, the employment rates of graduates from the field of teacher training and education, which is mainly chosen by women, tend to be lower than that for more male-dominated fields of study. Indeed, for all fields of study, the employment rate among men is significantly higher than that among women.

      Obviously, this has an impact on men’s and women’s earnings. Some fields of study lead to higher wages than others; these are usually male-dominated fields. Inactivity and employment patterns also add to gender gaps in earnings. But how important are the differences in men’s and women’s choices of field of study in explaining overall gender inequality in, for example, earnings?

      The gender gap in earnings can be attributed to average earnings differences between fields of study and different rates of participation in the labour market and in employment; but it is also related to the gender-stereotyped  profiles of occupations and career developments within each field.

      To assess the latter, it is interesting to look at earnings differences between men and women in a specific field of study, preferably one where gender differences in graduation are not too large, such as in social sciences, business and law. Some 27% of all 25-64 year-old respondents in the Survey of Adult Skills had graduated from this field, with a difference of only a few percentage points between men and women. On average across OECD countries and subnational entities surveyed, women working in this field earn only 75% of what men earn. In Chile and Japan, women who graduated from social sciences, business and law earn less than 60% of what men in the same field earn.

      Gender-related differences in labour-force participation or in salary schemes are certainly not the main reasons for these earnings disparities: even in a region with high female participation in the labour force and legislated gender equality in labour conditions and salary, such as Flanders (Belgium), women still earn more than 25% less than what men working in the same field earn.

      Tackling gender inequalities in employment and income will require the dismantling of gender stereotypes of fields of study and occupations. Getting more young women into the field of engineering and more young men into teacher training would be an excellent first step. But we also need to remove the glass ceilings and the explicit and implicit discriminations in the labour market and the professions that prevent women from occupying more senior positions within specific fields. As is evident in this year’s edition of Education at a Glance, even within a largely female-dominated field such as education, school principals still are predominantly men. It’s about time that we remove all the obstacles that prevent half of the world’s population from allowing their skills and talents to flourish unimpeded.

      Links:
      Education Indicators in Focus No. 45: Fields of education, gender and the labour market, by Gara Rojas González, Simon Normandeau and Rie Fujisawa.
      Indicateurs de l'Éducation à La Loupe No. 45: Domaines d’études et marché du travail: où en sont les hommes et les femmes ?
      Education at a Glance 2016: OECD Indicators
      Survey of Adult Skills (PIAAC)

      Chart source: OECD, (2012, 2015) Survey of Adult Skills (PIAAC), www.oecd.org/skills/piaac/publicdataandanalysis.

      Tuesday, 25 October 2016

      In case you haven’t heard…

      by Andreas Schleicher
      Director, OECD Directorate for Education and Skills

      It’s (almost) that time again: in just a few short weeks we’ll be hearing a lot more about how well our education systems are doing compared with others around the world. On 6 December, the latest results from the OECD Programme for International Student Assessment, better known as PISA, will be made public. If you aren’t yet sure about what PISA is or how it works, check out this new video. And watch this space: there will be more PISA-related information posted here in the coming weeks to help you understand what everyone will be talking about when the results from the 2015 assessment are released.


      Links:
      PISA
      The Alliance for Excellent Education and OECD webinar : PISA 2015: A Sneak Preview 
      Tuesday 25 October 2016 9:30 am – 10:30 am ET
      Bob Wise, president of the Alliance and former governor of West Virginia and Andreas Schleicher, OECD Director for Education and Skills share sample questions from PISA and discuss how PISA can impact education policy around the world.
      Watch webinar here.
      Follow #OECDPISA on twitter

      Wednesday, 12 October 2016

      How to administer "Emotional First Aid"

      Do you know that feeling lonely impacts your ability to build up an immunity after getting the flu vaccine?

      From the Google Talks lecture series: "Although we have bandages for cuts, chicken soup for colds, and ice packs for bruises, most of us have no idea how to treat day-to-day emotional injuries such as failure, rejection, and loss. But, as Guy Winch, Ph.D., points out, these kinds of emotional injuries often get worse when left untreated and can significantly impact our quality of life. In this fascinating and highly practical book he provides the emotional first aid treatments we have been lacking."

      Friday, 7 October 2016

      What can maths teachers learn from PISA?


      by Andreas Schleicher
      Director, OECD Directorate for Education and Skills

      When we think back on schools in the 20th century, we imagine rows of students facing the front of the classroom and listening to the teacher lecture. Even though more and more education policies over the past 20 years are encouraging teachers to give students the chance to actively participate in their learning, in 2012, only one in four students across OECD countries reported that their teacher asks them to break out into small groups to work out a problem on their own.

      Of course, teachers want students to enjoy the learning process but they also want students to focus on the topic at hand, keeping disorder in the classroom to a minimum. OECD’s newest report, Ten Questions for Mathematics Teachers… and how PISA can help answer them, based on PISA 2012 data, delves into diverse teaching and learning methods and what works for different types of classrooms around the world.

      When it comes to learning mathematics, certain teacher-directed learning strategies, such as asking questions to check whether students understand what has been taught, has proven to work well when solving basic mathematics problems. And research does show that student-oriented strategies, such as allowing students to collaborate and direct their own learning, can have a positive impact on their learning and motivation.

      But teacher-directed strategies, and in fact all teaching strategies, work best when teachers also challenge students and encourage them to focus more on the process rather than the answer. These types of strategies, known as cognitive-activation strategies, ask students to summarise, question and predict – requiring students to link new information to information they have already learned and apply their skills to a new context where the answer to a problem is not immediately obvious or can even be solved in multiple ways. In fact, PISA data indicate that across OECD countries, students who reported that their teachers use cognitive-activation strategies more frequently in their mathematics classes score higher in mathematics.

      Depending on the classroom environment, teachers understand that they need to combine different strategies to ensure that students grasp the basic concepts but are also able to advance further when ready, tackling more challenging problems on their own.

      Ten Questions for Mathematics Teachers explores these topics along with others that are relevant for mathematics teachers today. The report takes findings based on PISA data and organises them into ten questions encompassing teaching and learning strategies, curriculum coverage and various student characteristics, looking at how they relate to student achievement, mathematics instruction and to each other. Ten Questions aims to give teachers timely evidence-based insights that will help them reflect on their teaching strategies and how students learn.

      Links:
      Ten Questions for Mathematics Teachers… and how PISA can help answer them
      Equations and Inequalities: Making Mathematics Accessible to All

      Webinar - Friday, October 7, 2016 9:30 am – 10:45 am ET
      Ten Questions for Mathematics Teachers… and How PISA Can Help Answer Them Presented by The Alliance for Excellent Education and OECD. 

      Photo credit: © OECD